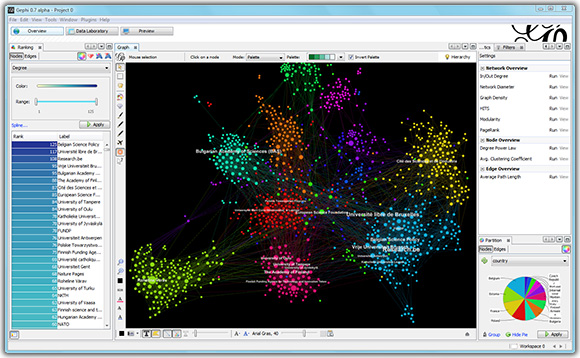
GUI Description
From Gephi:Wiki
Contents |
Global visual framework
Organization
Gephi is a flexible desktop application and a visual framework: it never constraints the user to do some tasks in a predefined way. On the contrary, the user is free to arrange the environment, move panels, show/hide windows...The GUI is set by default for three task families grouped as "Overview", "Data Laboratory" and "Preview".
Modes are accessible under the main menu:
- Overview: graph manipulation mode.
- Data Laboratory: data visualization in tables.
- Preview: visual tuning before vectorial export.
Menu
File
| Name | Description | Shortcut |
|---|---|---|
| New Project | Create a new project (session work). | Ctrl+Maj+N |
| Open | Open a project or graph file, like a GraphML, DOT, GML, GEXF... | Ctrl+O |
| Close Project | Close the project. | |
| Properties | Project information. | |
| Import Database | Graph import from a database connection. | |
| Import Spigot | Graph import from an external source (APIs, Graph DB, multiple files etc.) | |
| Generate | Create a graph from a model, like a random graph. | |
| Save & Save As | Save the current project. | Ctrl+S |
| Export | Create a graph file in GDF or GEXF, or export in vectorial format like SVG or PDF. | |
| Exit | Close the software. |
Workspace
| Name | Description | Shortcut |
|---|---|---|
| New workspace | Create a new workspace. | Ctrl+N |
| Delete workspace | Delete the current workspace. | |
| Duplicate workspace | Duplicate the current workspace. | |
| Clean workspace | Remove all data from the current workspace. |
View
| Name | Description | Shortcut |
|---|---|---|
| Full screen | Set Gephi in full screen mode | Alt+Maj+Enter |
Tools
| Name | Description |
|---|---|
| Plugins | Center for downloading and managing plugins. |
| Languages | Change the language in the user interface |
| Options | Software options, like OpenGL, default fonts, proxy... |
Window
All windows/panels.
Plugins
All installed plugins having menus.
Help
| Name | Description |
|---|---|
| Check for updates | Find software and plugins updates. |
| About | Information about the software. |
Workspaces
A workspace is a whole environment for exploring one graph. If you want to analyze more graphs simultaneously, you need to create new workspaces. Create, delete and clean workspace data from the Edit menu.
Note that each new graph import creates a new workspace if you select the "Add full graph" option in the import window. Hence you are still able to work on the first graph later.
Overview
Graph and Tools
List of the interaction tools
Tools are components which act and react on the graph. They are represented by an icon and a toggle button. Only one tool can be active in the same time
| Name | Description | Icon |
|---|---|---|
| Full screen | Not exactly a tool: set Gephi in full screen mode. | |
| Direct selection | Highlight nodes under the cursor. | |
| Rectangle selection | Nodes are selected under the rectangle. | |
| Drag | Move selected nodes. | |
| Brush | Color nodes and its nearest neighbors by pressing mouse left button. | |
| Sizer | Size nodes by pressing mouse left button and dragging up or down. | |
| Painter | Color nodes by pressing mouse left button. | |
| Node Pencil | Add new node on the graph where mouse is clicked. | |
| Edge Pencil | Add new edge by clicking on source and then target. | |
| Shortest Path | Display the shortest path if exist between two clicked nodes. Directed graphs only. | |
| Heat Map | Set color intensity on a node neighborhood, by the distance. Directed graphs only. | |
| Edit | Edit node attributes. |
List of the reset actions
| Name | Description | Icon |
|---|---|---|
| Center on graph | Move the camera to see the whole graph. | |
| Center on zero | Move the camera to the coordinates {x=0,y=0,z=0}. | |
| Reset colors | Set node colors to black. | |
| Reset size | Set node size to 1. | |
| Reset label colors | Set label colors to black. | |
| Reset label visible | Show all labels. | |
| Reset label size | Set label size to default. |
List of the visual properties
Layout
Select an algorithm and set parameters on the fly. Save them into presets.
Ranking
Set numerical attributes to distribute node/edge colors, sizes, label colors and label sizes. Right-click on the window to display the ranked list of nodes or edges.
Partition
Node or edge grouping on attribute or computed metric. A color is assigned to each group, and can be changed by right-clicking on the window.
Statistics/metrics
Run metrics and save reports in HTML. Node and edge computed results are available as attributes.
Filters
A library of filters is available to combine. The user drag the filter (i.e. Degree Range) to build the query, and then set the parameters visually. He finally choose to apply the query output to select elements or to filter them. When the filtering is activated, changes appear in real time.
Timeline
Move left and right cursors to filter the graph on time intervals.
The timeline opens automatically when you open a dynamic network. Enable the timeline to set the time interval. Drag the bounds of the interval using your mouse.
Context
Display the number of nodes and edges, the type of the graph and the percentage of visible nodes.
Edit
See and edit attributes of a selected node. This window appear by using the related tool.
Data Laboratory
Show nodes and edge attributes in table, and allow dynamic regexp filtering.
Preview
Settings
Customizable visuals for vectorial export, which could be saved in presets.
Visualization
Fine tuning on nodes, edges and labels rendering.


